In the weeks before Mother’s Day 2025, Proya promoted skincare through family stories on Douyin. Creators associated its Ruby gift sets with spending time with mothers, taking trips and looking after relatives. L’Oréal Paris was running an overlapping campaign for its own anti-aging products. Its creator posts also put family relationships around a gift box. The two collections occupy much the same territory: affection, an occasion to buy, a product that promises to help someone look after herself. Proya campaign, L’Oréal campaign.


Explicit mother or family language appears in 12 of 15 Proya captions and 41 of 50 L’Oréal captions in these two archived campaigns, after removing hashtags. Similar language does not establish equal reach or effectiveness. These are video covers; image credits and ownership.
Proya was making a straightforward claim: we can do this too. By using the same promotional mechanism as L’Oréal, it presented itself as a peer—capable of putting together the kind of offer an established international beauty brand could make. The resemblance was the point. Proya did not need to invent a new way to sell skincare to challenge L’Oréal; it could compete through a mechanism shoppers already understood, with its own products at the centre.
By then, the change extended well beyond cosmetics. Chinese automakers supplied 60% of global electric-car sales in 2025, according to the International Energy Agency. Roborock reported more than half its annual revenue overseas. Pop Mart had turned collectible characters into a business with annual revenue above RMB37 billion. These were very different purchases, requiring very different reasons to trust the seller. IEA, Roborock results, Pop Mart results.
The useful question is how that trust became a business. A cheaper machine still needs a reason to enter someone’s home. A technically capable car needs places to test, buy and service it. An appealing character needs a name people remember, a supply of products they want and a way to distinguish the genuine article from a copy.
Campaign evidence lets us examine those intermediate steps. For this article, we searched unrandom’s inventory of 32,538 generated campaign write-ups and brand-market dossiers, closely screened 122, and retrieved source records for 904 distinct posts. We also analyzed the full 45,276-record China-platform campaign metrics census and recurring account participation across 921 eligible TikTok brand–market groups. The charts below move between those broader patterns and complete archived cohorts for selected campaigns. The financial record establishes the scale of the businesses. The posts show the offers, demonstrations and objections through which parts of those businesses met customers. They also complicate the tidy story: foreign competitors use many of the same methods, and the Chinese brands that grew most quickly have not escaped price resistance, maintenance complaints or falling sales.
Across these cases, the advance has several forms. Some companies make a familiar job easier. Some make a purchase more accessible. Some organize a community around what their product lets people do. Some create an object that customers want precisely because of the name or character attached to it. The 2022–2026 period shows these capabilities operating at much greater commercial scale, with different results in each industry.
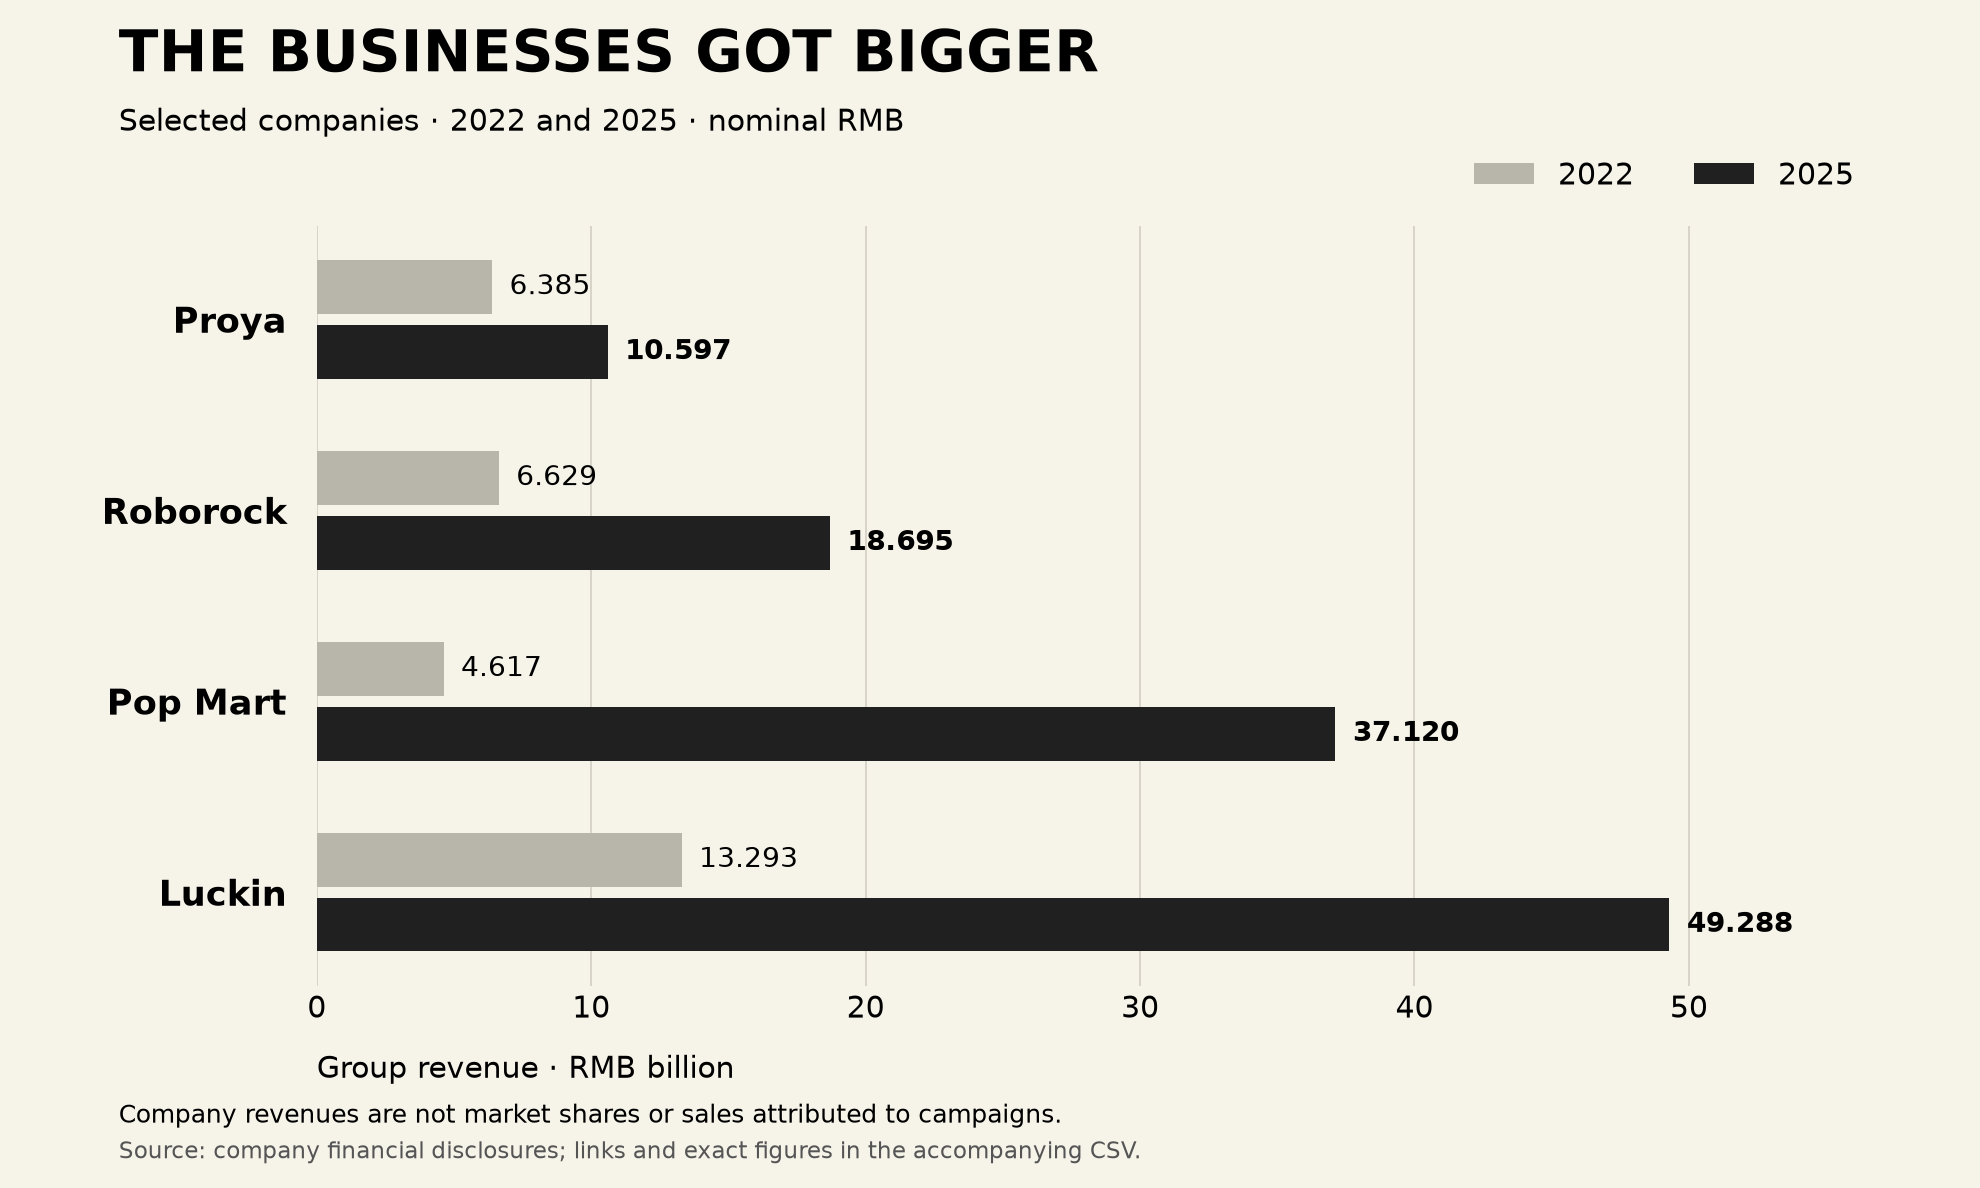
Selected group revenues, nominal RMB billion. These are company totals across their reported portfolios and markets, not category market shares or campaign-attributed sales. Download the figures and source links.
2022 began with substantial businesses
The starting point matters. This was not the year Chinese companies first discovered brands, international customers or product development. In 2022, BYD already sold more than 1.86 million new-energy vehicles, a category including battery-electric cars and plug-in hybrids. Proya’s group revenue was RMB6.385 billion. Luckin had 8,214 stores. A story that begins with anonymous factories and ends four years later with recognizable brands would erase the businesses that made the later expansion possible. BYD, Proya, Luckin.
Roborock supplies a useful baseline. Its group revenue was already RMB6.629 billion in 2022. By 2023, the company reported availability in more than 40 countries and overseas operations accounting for 49% of revenue. It was expanding an international business it already had. Its later growth cannot be explained as the simple discovery of foreign demand. Roborock financial release.
The early campaign material also contains ambitions beyond being inexpensive. In January 2022, a Roborock promotion connected its G10 cleaning robot with a Sanxingdui-themed blind-box creative. An archived caption brought ancient civilization into contact with a modern household machine. Among the retained comments was an objection to a roughly RMB4,000 price. Another discussed a shopping promotion and gift. The purchase was already a negotiation among novelty, convenience, price and the deal available that day. Sanxingdui caption, Price-objection thread.
That negotiation also appeared in Chinese sportswear. ANTA’s early-2022 skate-related creator material combined performance, style and Wang Yibo’s presence. One inspected comment thread questioned paying around RMB500 for the domestic brand and invoked Vans. The comment does not tell us how many buyers felt that way. It does preserve a specific obstacle: a Chinese name could attract attention while still being asked to justify a price against an established foreign alternative. ANTA creator caption, Price-objection thread.
A price objection is not the same as a rejected purchase. It identifies the argument a seller must win. A washing machine may justify its cost through less work. A shoe may do so through performance, fit, a public figure or the identity of its wearer. A collectible may be valuable because a cheaper substitute is the wrong character or the wrong edition. The companies in this story were developing different answers to that problem.
The car campaigns make this concrete. A September 2022 Xiaohongshu caption connected the BYD Dolphin’s external power supply with a family picnic and outdoor entertainment. An October travel-and-photography caption described using the car to charge equipment. In these accounts, an engineering feature acquired a purpose outside the specification sheet: the car could supply electricity to an activity the customer already wanted to do. Picnic post, Photography post.
The same creative translation was available to foreign brands. Later Volkswagen ID.3 posts in the archive combined outings, sun protection, novice-friendly driving and a price around RMB120,000. Xiaomi’s SU7 material placed comfort features inside a travel story. These vehicles occupied different segments and the posts came from different periods; they are not a matched test of automotive value. They show competitors making technical choices legible through ordinary life. VW outing post, Xiaomi travel post.
These were already substantial businesses asking buyers to pay for performance, convenience and identity. The ANTA price objection captures the contest: could a Chinese name command a price shoppers associated with an established foreign brand? The campaigns were making that case, even when customers pushed back.
2023 made the next purchase step explicit
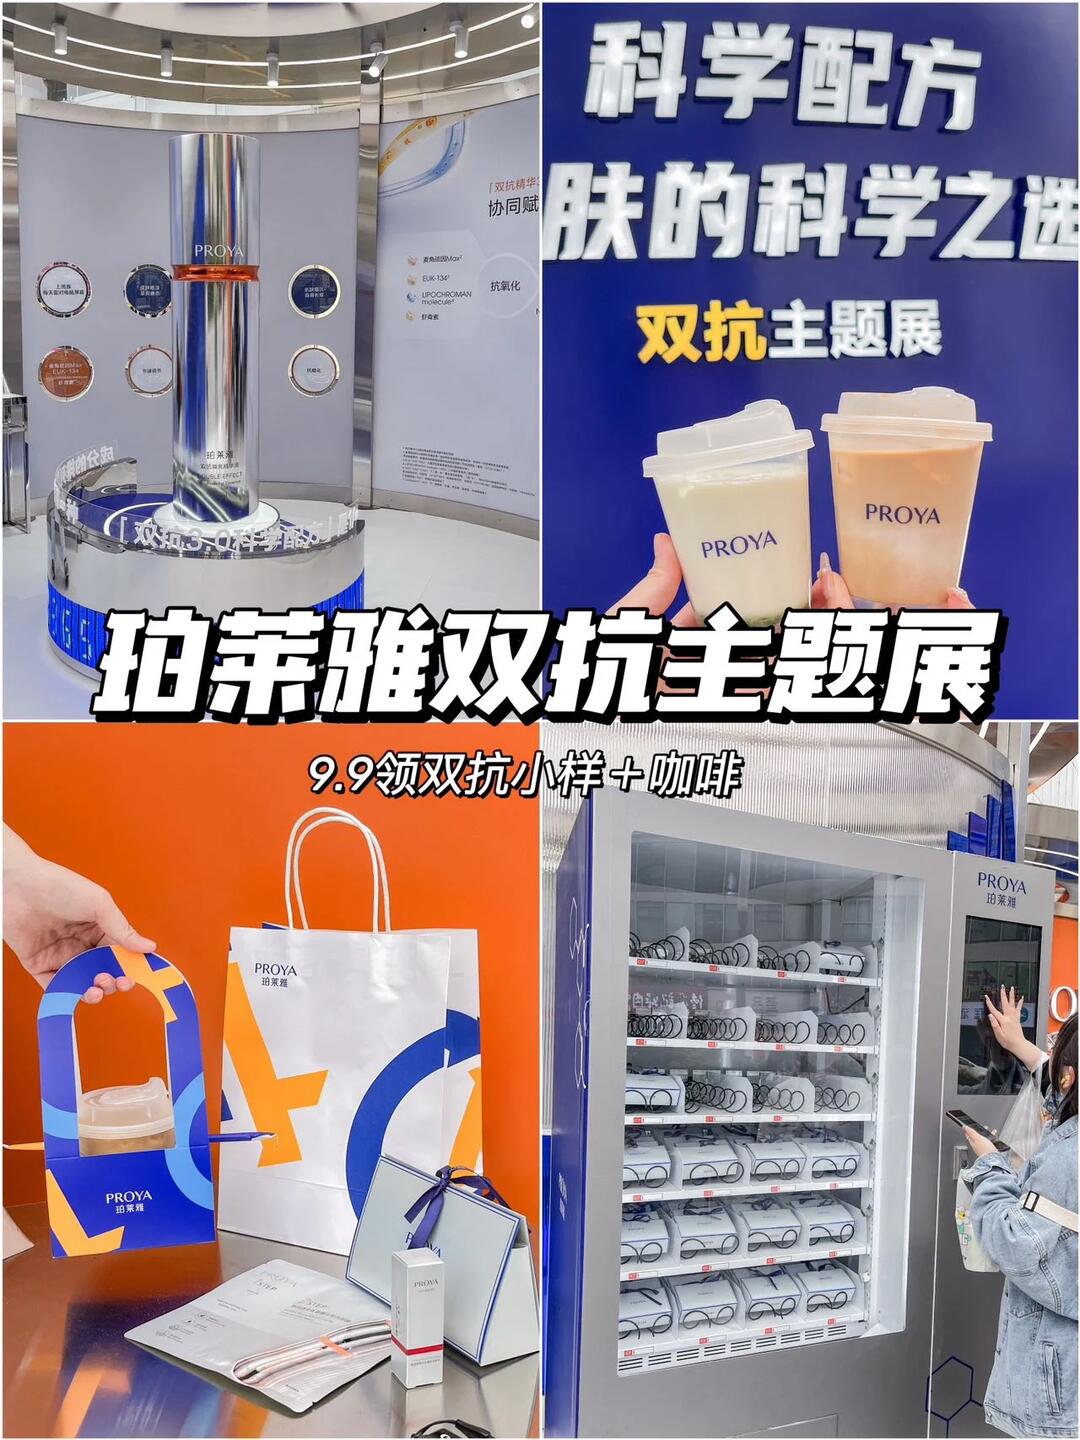
In May 2023, Proya’s skincare promotion could begin with a drink.
An archived Nanjing post described a RMB9.9 offer involving samples and a drink, for new members. A Chongqing caption in the same collection directed customers to collect a mask at a counter. The Nanjing offer also included a RMB150 voucher conditional on spending RMB600. Other posts in the same campaign collection described related events in several cities. The low entry price gave a prospective customer something concrete to try; the membership and voucher supplied routes to a larger transaction. Nanjing source caption, Chongqing source caption.
The fuller collection shows which parts of the offer travelled most consistently. Of its 136 captions, 129 mentioned RMB9.9. Twenty used new-member or signup wording; eleven described collecting something at a counter. The simple price was repeated much more often than the detailed next steps. That is a pattern in the captions, not evidence that a customer could reach the counter without being told the terms.
UNRANDOM / 136 CAPTIONS · APRIL–MAY 2023
The price travelled further than the detailed terms
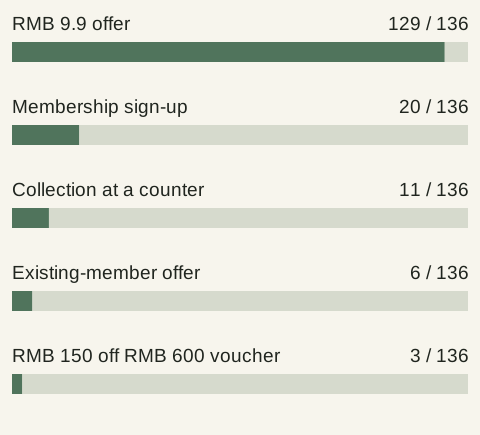
Figures and method
| Caption wording | Captions |
|---|---|
| RMB9.9 offer | 129 |
| New-member / signup wording | 20 |
| Collection at a counter | 11 |
| Existing-member offer | 6 |
| RMB150 off RMB600 | 3 |
Source: unrandom campaign archive; Brandnotomy calculations. Download data (CSV) · How we counted
Each step asked for a different commitment. Reading a skincare recommendation costs little. Visiting a counter costs time. Paying for a trial requires less confidence than buying a full-size routine. Registering gives the brand a way to maintain contact. A conditional voucher gives the customer a reason to consider a higher basket. The offer joined these decisions rather than leaving the viewer to work out what to do after encountering the product. The archive preserves the offer, but not its redemption or repeat-purchase results.
The physical setting did not mean that Proya was becoming an offline-led retailer. By 2025, online channels accounted for 95.58% of the group’s main-business revenue. The counter could serve as a place to encounter the product even while most recorded revenue flowed through online channels. A consumer’s sequence of discovery, trial and purchase need not resemble the company’s accounting categories. Proya annual filing.
Nor was this sequence a Chinese invention. An inspected LEGO event caption from September 2024 described registration through a mini-program, a digital minifigure, activities at a physical event and a gift linked to social sharing. The products and occasions differed, but the commercial logic was recognizable: give the visit a structure, collect a continuing connection and make participation easy to explain to someone else. LEGO event caption.
Coffee compressed several of these decisions into a much smaller purchase. Luckin’s Moutai-flavored latte launch in September 2023 gave customers a familiar luxury name in an inexpensive, immediately consumable format. The company reported selling 5.42 million cups on launch day. That is an issuer-reported product-launch result, not a measure of what any individual influencer contributed. It nevertheless shows how a novelty could be distributed through a store network quickly enough to become a very large transaction event. Luckin presentation.
The distinction between the event and the business appears in the subsequent numbers. Luckin reached 31,048 stores and RMB49.288 billion in annual revenue in 2025. Its self-operated same-store sales had fallen 16.7% in 2024 before rising 7.5% in 2025. Opening more locations and generating more sales at existing locations are separate achievements. The network can grow while the average established shop has a difficult year. Luckin 2025 results.
Chagee offers another version of the distinction. Its 2024 anniversary material connected tea with friendship, sporting appearances and family occasions. By the fourth quarter of 2025, however, the company reported a 25.5% fall in same-store gross merchandise value. The campaign placed a cup inside a social ritual; the later results show a business facing deteriorating sales at established stores. Chagee campaign, Chagee results.
These beverage businesses belong in the broader account of Chinese brands because they show how distribution changes the meaning of demand. A launch that customers cannot obtain is a different commercial event from one available through thousands of shops. At the same time, a large network commits a company and its operators to rent, labor, equipment and recurring purchases. Attention can arrive in a burst. Those obligations continue after the burst ends.
The medium around these offers was also changing. Holding the brand identifiers constant, unrandom’s Xiaohongshu archive shows the average share of video posts within campaigns rising between 2022 and 2024. The increase survives a requirement for at least three campaigns per brand in every year and a comparison restricted to January–June. Beauty, food and fashion subsets move in the same direction. This describes the competitive environment in which Chinese and foreign brands operated; it does not show that Chinese brands alone drove the change, or that a video necessarily demonstrated a product.
UNRANDOM / XIAOHONGSHU · 2022–2024
More video, within the same brands
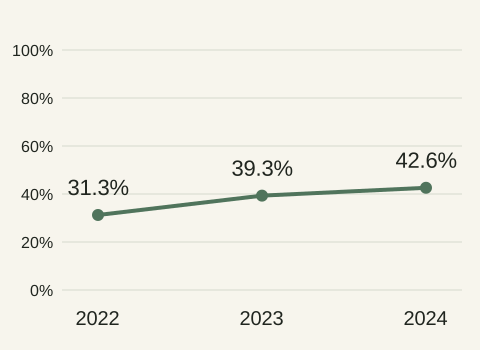
Why the line stops in 2024. The 2025 direction changes with the activity threshold: a 75-brand first-half panel falls from 44.5% to 40.3%, while a stricter 17-brand panel rises from 37.8% to 42.9%. The archive does not establish a continuing rise or a reversal. See the sensitivity figures.
Figures and method
| Year | Video share | Campaigns |
|---|---|---|
| 2022 | 31.3% | 1,604 |
| 2023 | 39.3% | 2,986 |
| 2024 | 42.6% | 3,125 |
Source: unrandom campaign archive; Brandnotomy calculations. Download data (CSV) · How we counted
Proya’s RMB9.9 offer asked for a small trial before a larger skincare commitment; Luckin put a taste of Moutai within reach for the price of a coffee. Both made it easy to try a proposition that might otherwise feel unfamiliar or out of reach. For an established competitor, the challenge was concrete: the customer had an accessible reason to spend elsewhere today.
2024 brought the machine into the house
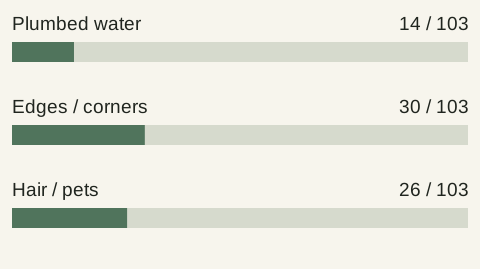
In February 2024, a Xiaohongshu creator described altering a wall to install a Roborock P10S Pro with automatic water supply and drainage. The caption listed the things the installation needed: a tap, power and somewhere for the water to go. It suggested a version with a water tank for homes where renovation was impractical. Archived installation caption.
The passage changes the purchase from an abstract comparison of cleaning performance into a decision about a particular home. A buyer needs to know where the dock fits, whether the connections exist and what happens if they do not. The machine’s convenience depends partly on the building around it.
This is a more demanding proposition than showing a robot crossing a clean floor. Automatic cleaning creates an expectation that the owner will spend less time tending the machine. The water connections, dock, dimensions and maintenance routine become part of the product’s value. A feature that sounds minor in a specification table can determine whether the customer can obtain the advertised convenience at all.
A May post in the same collection took the form of a pet-owner buying guide, comparing the P10S Pro with machines from Ecovacs and Narwal. Another segmented Roborock models by budget, pets, furniture clearance and other household needs. The brand was being explained through a set of choices within a category, including choices among Chinese competitors. Pet-owner guide, Model-selection guide.
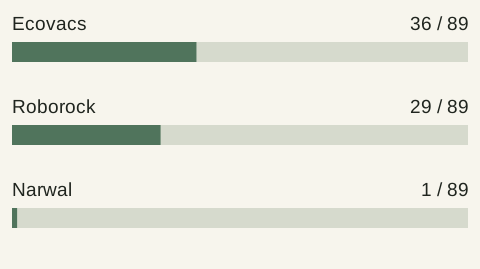
Later Dreame material makes that competitive setting especially explicit. Expanding the selected 2025 collection to all 89 captions, 36 named at least one competing cleaner brand in the body text: all 36 named Ecovacs, 29 also named Roborock, and one named Narwal. Hashtags were excluded. The examples compared particular models and features rather than presenting one Chinese machine as an alternative to a single foreign benchmark. Domestic-peer comparisons also appear in the earlier records, so this is evidence of an established competitive field, not a precisely dated moment when the hierarchy flipped. One three-brand comparison.
UNRANDOM / DREAME · 89 CAPTIONS · MARCH–APRIL 2025
The rivals were inside the buying guide
Figures and method
| Rival named | Captions / 89 |
|---|---|
| Ecovacs | 36 |
| Roborock | 29 |
| Narwal | 1 |
Source: unrandom campaign archive; Brandnotomy calculations. Download data (CSV) · How we counted
UNRANDOM / ROBOROCK · 103 CAPTIONS · FEBRUARY–JUNE 2024
The room became part of the pitch
Figures and method
| Audited vocabulary | Captions / 103 |
|---|---|
| Edges / corners | 30 |
| Hair / pets | 26 |
| Plumbed water | 14 |
Source: unrandom campaign archive; Brandnotomy calculations. Download data (CSV) · How we counted
These are different campaigns, years and product mixes, not a controlled comparison between the two brands.

The customer’s objection could be more practical than any brand comparison. A retained comment under a Tineco review described hair and debris that still needed manual attention despite the machine’s self-cleaning claim. Other comments recommended competing brands in both directions: a Dyson thread contained a preference for Tineco, while a Tineco thread contained a recommendation to buy Dyson. The useful fact is that the labor-saving proposition was being contested at the level of the remaining work. Tineco review, Dyson post.
Roborock’s business record gives this product discussion a commercial perimeter. Group revenue rose from RMB6.629 billion in 2022 to RMB11.945 billion in 2024 and RMB18.695 billion in 2025. These figures cover the company’s portfolio, not just the models in the inspected posts. They connect the campaign observations to growth in the same business, without assigning that growth to the sampled campaigns. Earlier financial release, 2025 annual report.
The larger business spent RMB1.42 billion on R&D in 2025, but growth did not translate into higher profit that year. Net profit attributable to shareholders fell 31.03% to RMB1.363 billion. The company had more revenue and more products to support, while retaining less of the year’s earnings. Scale expanded the resources available for competition without settling its economics. Roborock results, Annual report.
The consequences for an incumbent became unusually literal in January 2026. iRobot announced that Picea, its principal contract manufacturer and secured lender, had acquired all its equity through a court-supervised transaction. The supplier had become the owner. Roomba remained a foreign-origin brand; the transaction did not retroactively turn its earlier products into Chinese-origin launches. It did demonstrate that industrial capability could change a market’s ownership as well as its product rankings. iRobot closing announcement.
In these buying guides, the Chinese machines were the products being compared with one another. Roborock, Dreame, Ecovacs and Narwal were helping set the terms of the purchase: how much work would the machine actually remove? An established foreign name now had to enter that comparison and justify its place in it.
2025 required a place to buy the car
The BYD Dolphin’s camping and equipment-charging stories made the car useful in the language of a creator’s day. Taking the business abroad required a different kind of proof.
At its 2025 launch, BYD’s UK Dolphin Surf price list started at £18,650. The entry Active version offered 137 miles of advertised WLTP range; the £21,950 Boost offered 200 miles. A near-date Citroën announcement, on May 28, priced the ë-C3 PLUS at £21,990 with up to 199 miles. The cheapest BYD was £3,340 below that Citroën, but the versions with similar quoted range were just £40 apart. Equipment, space and charging still differed. The attractive entry price was real; so was the work required to make a meaningful comparison. BYD launch specification, Citroën’s May announcement.
For a car buyer, the total proposition extends far beyond the initial number. There must be somewhere to see the vehicle, someone who can explain the versions, and a credible organization to address problems after delivery. A creator can make an unfamiliar car interesting. A dealer network makes it possible to carry the decision further.
On December 23, 2025, BYD announced that it would close the year with 125 franchised UK dealership sites, compared with 52 twelve months earlier. The announcement described a network of 38 retail partners. This is a concrete increase in the places and organizations connecting the manufacturer to customers. It also means the brand was asking local businesses to commit space, staff and capital to its products. BYD dealership announcement.
Support continued to expand after the launch. In January 2026, BYD extended eligible UK and European traction-battery warranties to eight years or 250,000 kilometres, including existing vehicles, with a minimum battery-health threshold. In September it announced 138 approved accident repairers in the UK. Those repairers are a different network from the dealerships. Together, the announcements address a question a launch price cannot: who will stand behind the car after the purchase? Battery warranty announcement, Repair network.
BYD’s global vehicle growth establishes the scale behind that expansion. The company’s new-energy vehicle sales rose from more than 1.86 million in 2022 to about 4.60 million in 2025. These totals include plug-in hybrids as well as battery-electric vehicles. They should not be set against a battery-only competitor as though the product categories were identical. 2022 baseline, 2025 result.
The wider market was also moving. The IEA’s 60% figure refers to Chinese automakers’ share of global electric-car sales in 2025. It does not mean Chinese brands supplied 60% of all cars. The same report describes a market shaped by trade-in incentives, tax changes and emissions policy. Consumer choice took place inside those changing rules and prices. IEA.
Trade policy also changed the calculation. In October 2024, the EU imposed an additional 17% countervailing duty on qualifying China-origin electric vehicles from listed BYD entities, on top of the ordinary import duty. That measure applied to EU imports, not the UK examples above; it was defined by product and origin, not simply by Chinese brand ownership. The same car business could face different economics across neighboring markets. EU regulation, Commission explanation.
Even shipped cars and sold cars are different milestones. The IEA estimates that electric-car exports from China exceeded overseas sales by more than 25% in 2025, raising the possibility of accumulating inventory. The physical presence of a product in another country is an intermediate step. It becomes consumer demand only when someone buys it. IEA trade analysis.
At comparable advertised range, the BYD and Citroën were only £40 apart. BYD’s challenge went beyond the headline of a cheaper Chinese car: it was assembling the dealers, warranty cover and repair network needed to make choosing it a credible long-term commitment. The competitive offer now extended across the ownership experience.
A printer could sell the things its owner wanted to make
Bambu Lab, founded in 2020 and headquartered in Shenzhen, gives the overseas story a different starting point. A prospective customer may not yet think they need a 3D printer. Company background.
In a May 2025 TikTok post, a Mexico-labelled creator introduced an A1 Mini Combo as a first printer and pointed viewers to AG Electrónica to buy it in Mexico. An artist’s July post separated three destinations: the official product site, MakerWorld’s design library and a local reseller. The caption identified the collaboration. These posts did more than display a machine; they supplied a route to obtain it and a source of things to do with it. Beginner introduction, Artist’s collaboration post.
The distinction is important for a tool whose possible uses are much broader than a first-time buyer’s experience. A customer may understand a printer’s speed and still not know what to print. A library of available models reduces that gap. A local seller reduces another. The product can arrive with a first project already imaginable.
In October, a photographer described using a Bambu A1 to organize a studio. The archived caption and machine-translated track identify hooks, holders and other small pieces that gave equipment a place to go. The creator explicitly thanked the company for the collaboration. This was a practical account of a workspace, not just a claim about print speed or resolution. Photographer’s post.
The appeal here depends on the relationship among several components. The printer makes the object. The model file supplies a design. The software and print profile help convert it into instructions. The creator supplies a reason a particular person might want it. A buyer can encounter the intended result before learning much about the machine.
That sequence can make a technically unfamiliar category easier to enter. It also changes who can communicate its value. A photographer, craft maker or skateboarder can introduce a useful object through their own activity. Their audience does not need to begin with a general interest in additive manufacturing. The product becomes relevant at the moment it solves a recognizable problem or makes a desired object possible.
Some of the surrounding activity belongs to other businesses. One Bambu-tagged source promoted marker pens used to color a print. Another combined a Bambu machine with someone else’s filament and an xTool laser. Counting every such post as a Bambu-paid advertisement would mistake an ecosystem of separate sellers and users for one centrally managed campaign. Marker post, Multi-tool project.
The distinction does not make that activity irrelevant. A product can become commercially important partly because other people find ways to build around it. In November 2025, a designer announced files for a printer stand whose initial exported sizes focused on Bambu’s H2D, with support for other printers planned. That is a small, specific instance of a third party designing around a Bambu product. It does not establish that the whole category had accepted Bambu as its benchmark. Printer-stand post.
Nor are downloadable designs or maker communities exclusive to Bambu. Their relevance here is that they form part of the customer’s practical experience of this Chinese-origin brand. They extend the offer beyond the box containing the machine. For the purchaser, the question can become whether there are enough things worth making, whether the process is manageable and whether help is available when it fails.
Failure is part of the same proposition. Bambu’s February 2024 A1 recall update told owners to stop using the affected model and offered refund or replacement-heatbed routes. The subsequent US recall notice required a professional repair for the replacement option; it expressly ruled out consumer self-repair. These notices concerned the A1, not the A1 Mini in the Mexican introduction. The customer relationship now included the cost and inconvenience of making an existing machine safe. Bambu update, US recall notice.
Bambu’s stronger claim was that other people could make its printer more useful. A photographer supplied a reason to buy; designers supplied files and accessories; local sellers supplied a way to obtain it. The competitive offer became larger than the machine: a rival had to answer the things a buyer could already imagine doing with a Bambu.
The household supplied more than one market
The same practical language carried smaller appliances into parenting and personal care. In a late-2025 Momcozy post, a creator acknowledged that a bottle washer was expensive, then argued for it through the time it could save and a Black Friday discount. Another supplied a named code alongside a washer and cooler. The customer was being asked to consider both a household task and a family of products around it. Washer recommendation, Washer and cooler offer.
Momcozy’s Chinese operating connection is documented: an FDA device record identifies Shenzhen Root Innovation Technology as the applicant for one of its wearable breast pumps. That establishes an entity behind a product, not the brand’s ultimate ownership or the effectiveness of every item it sells. In the campaign material, the more consequential identity is often the task: washing bottles, carrying supplies or getting out of the house. FDA device record.
Hair tools supplied a similar opening. Wavytalk, whose Shenzhen background is described in a founder interview, appears in tutorials about styling technique, controls, attachments and noise. A September 2024 post directed viewers to the brand’s own livestream for gifts and discounts. The route led from another person’s explanation to a sales event run through the brand’s account. Founder interview, Livestream referral.
Momcozy and Wavytalk were asking buyers to judge an unfamiliar name through a task they knew intimately. The bottle-washing routine and the styling demonstration gave that name something specific to stand for. This was a route into parts of the household where an established brand’s familiarity might otherwise make it the easier choice.
Overseas posts kept returning to the same names
An individual recommendation is a moment. The archive also lets us ask whether the same accounts kept posting about a brand over a longer period.
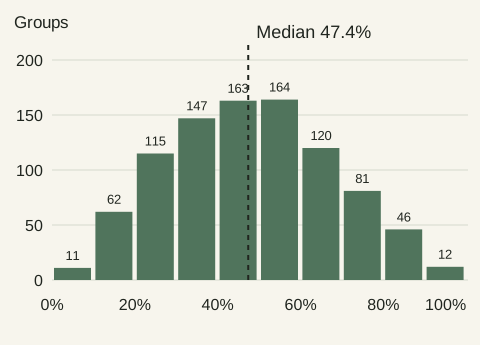
We counted all eligible 2025 TikTok brand–market groups with at least 100 captured posts and 20 identified accounts, excluding posts explicitly marked as coming from the brand’s own account. In 418 of the 921 groups, more than half the posts came from accounts whose first and last brand-associated posts were at least 30 days apart. Across all eligible groups, the median share was 47.4%. Restricting the analysis to groups with captured posts in every month of the year produced a similar median, 49.6%.
UNRANDOM / TIKTOK · 921 BRAND–MARKET GROUPS · 2025
The accounts that kept appearing
Figures and method
| Measure | Result |
|---|---|
| Eligible brand–market groups | 921 |
| Brand-post memberships | 382,458 |
| Median qualifying share of posts | 47.4% |
| Groups with posts in all 12 months | 688 |
| Median post share in that subset | 49.6% |
Source: unrandom campaign archive; Brandnotomy calculations. Download data (CSV) · How we counted
The selected article cases put that pattern into different kinds of business. Accounts spanning at least 30 days supplied 336 of the 429 captured Bambu Lab posts in the US-labelled group. For Momcozy, they supplied 925 of 1,503; for Pop Mart, 1,424 of 1,991. Printing projects, household equipment and collecting could each generate material beyond a single introduction.
SELECTED US CREATOR-MARKET EXAMPLES
What that looks like across products
Counts and source
| Brand | Qualifying posts / all | Qualifying accounts / all | Post share |
|---|---|---|---|
| Bambu Lab | 336 / 429 | 40 / 85 | 78.3% |
| Momcozy | 925 / 1,503 | 167 / 599 | 61.5% |
| Pop Mart | 1,424 / 1,991 | 171 / 596 | 71.5% |
| VEVOR | 1,004 / 1,483 | 142 / 500 | 67.7% |
| Wavytalk | 1,514 / 2,816 | 246 / 1,224 | 53.8% |
| Samsung | 282 / 509 | 37 / 198 | 55.4% |
Source: unrandom campaign archive; Brandnotomy calculations. Download data (CSV) · How we counted
This is recurring posting, not a count of renewed advertising contracts. A brand-associated account may be a maker, affiliate, retailer, reseller or someone mentioning a product incidentally. The thirty-day test does not require a regular posting schedule. Samsung’s inclusion also makes clear that recurring accounts are not uniquely Chinese. What the archive establishes is the duration and contribution of these accounts within captured brand activity; the source posts explain what they were doing.
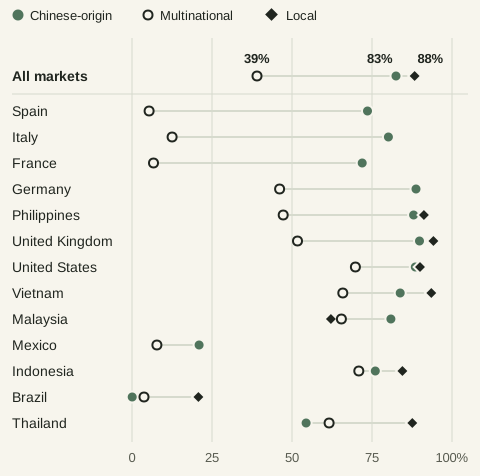
The same records show how those posts sold. For each captured post, the archive records whether TikTok marked it as carrying a shopping link. Across brand–market groups with at least 100 captured posts, the median share of posts carrying the link was 82.5% for Chinese-origin brands, 39.1% for multinationals and 88.3% for brands that sell in a single market. Shein and Temu are exceptions, at 1.8% and 0.6%; the measure counts only TikTok’s own link, so selling through a brand’s own app or site does not register.
UNRANDOM / TIKTOK · 1,835 BRAND–MARKET GROUPS · 25 CREATOR MARKETS
Who puts a shop link under the video
Figures and method
| Creator market | Chinese-origin | Multinational | Local |
|---|---|---|---|
| All markets | 82.5% (452) | 39.1% (1,082) | 88.3% (301) |
| Spain | 73.6% (12) | 5.4% (46) | – |
| Italy | 80.1% (17) | 12.5% (43) | – |
| France | 71.9% (23) | 6.7% (73) | – |
| Germany | 88.7% (30) | 46.1% (48) | – |
| Philippines | 88.0% (34) | 47.2% (38) | 91.2% (21) |
| United Kingdom | 89.9% (46) | 51.7% (184) | 94.2% (27) |
| United States | 88.5% (132) | 69.8% (350) | 90.0% (96) |
| Vietnam | 83.8% (18) | 65.9% (38) | 93.5% (23) |
| Malaysia | 80.9% (22) | 65.5% (20) | 62.2% (14) |
| Mexico | 21.0% (12) | 7.8% (21) | – |
| Indonesia | 76.0% (35) | 70.9% (48) | 84.5% (69) |
| Brazil | 0.1% (18) | 3.8% (54) | 20.7% (13) |
| Thailand | 54.4% (20) | 61.6% (22) | 87.6% (17) |
Median share of posts with a shopping link, with the number of brand–market groups in brackets. A market is the archive’s creator-market attribution, not the buyer’s location.
| Posts dated | Chinese-origin | Multinational | Local |
|---|---|---|---|
| 2024 | 72.5% (106) | 56.7% (167) | 86.6% (51) |
| 2025 | 65.5% (325) | 16.7% (865) | 79.8% (201) |
| January–June 2026 | 87.9% (468) | 53.6% (1,098) | 92.8% (309) |
The same medians by year of posting, for groups with at least 50 posts dated in that year. The set of captured brands changes from year to year, which moves the size of the gap; its direction does not change.
Within the same creator market and product category, using pairs with at least three groups of each kind: Chinese-origin above multinational in 28 of 31 pairs, average gap 22.6 points; Chinese-origin above local in 3 of 19, average gap minus 2.0 points; local above multinational in 23 of 28, average gap 21.4 points. Counting each brand once, a majority of posts carry the link at 85% of 179 Chinese-origin brands, 82% of 275 local brands and 56% of 439 multinationals.
| Brand, all creator markets | Posts with link / all | Share |
|---|---|---|
| VEVOR | 10,172 / 10,922 | 93.1% |
| Wavytalk | 8,769 / 10,208 | 85.9% |
| Momcozy | 4,999 / 6,976 | 71.7% |
| Dreame | 2,403 / 3,743 | 64.2% |
| Pop Mart | 2,959 / 5,698 | 51.9% |
| Bambu Lab | 347 / 1,466 | 23.7% |
| BYD | 12 / 667 | 1.8% |
| Shein | 2,449 / 133,549 | 1.8% |
| Temu | 285 / 46,161 | 0.6% |
| Samsung (multinational) | 850 / 5,222 | 16.3% |
Source: unrandom campaign archive; Brandnotomy calculations. Download data (CSV) · How we counted
These brands had become subjects people could keep making content about. Bambu could return through the next printing project, Momcozy through another household routine, and Pop Mart through another unboxing. The Chinese name could become a recurring part of the category’s conversation, giving buyers repeated occasions to consider it beyond a single launch.
The toy needed to be the right toy
Pop Mart presents a different kind of value. A cheaper object is a poor substitute if it is the wrong character.
Its 2024 Douyin Spring Festival material placed blind-box openings inside family gifts and holiday stories. The wrapper was familiar from beauty and food campaigns: an occasion, a relationship and something to give. The product inside introduced another structure. There were characters to recognize, versions to distinguish and uncertain contents to reveal. Pop Mart Spring Festival readout.

By May 2025, that structure could travel with a shopper across borders. In a TikTok post from Saigon Center in Vietnam, a creator compared prices and availability with the United States and described buying Labubu, Hacipupu and Skullpanda. The archive placed the creator in a US market collection, but the caption and transcript put this shopping account in Vietnam. What traveled was the shopper’s familiarity with the characters, along with a comparison of where to obtain them. Saigon Center post.
Later that month, another creator said a commenter had called his figure a fake. In the available transcript, he asserted that his purchases were genuine, promoted a seller on Whatnot and offered $15 toward a first purchase through a referral. He then continued opening figures and hoping for a rare one. Authenticity had become part of the sales pitch. The offer sent viewers to Whatnot and a seller the creator promoted; it did not identify Pop Mart as the sponsor. Whatnot referral post.
The seller’s authenticity claim remains a claim. But the distinction between genuine and imitation was consequential enough to draw regulatory attention. In August 2025, the US Consumer Product Safety Commission warned about small-part hazards in counterfeit and lookalike Labubu dolls. The warning concerned those imitations, not a recall of genuine Pop Mart products. A recognizable character had created a market in copies, and buyers needed to decide which seller to trust. CPSC warning.
Collecting also supplied its own disappointments. In June, a Skullpanda collector described receiving another figure she already had and offered the duplicate through a giveaway requiring a friend tag, with US-only shipping. The unwanted duplicate became material for another interaction. Duplicate and giveaway.
This is a different commercial problem from persuading someone that a cleaning robot saves time. The distinctions among characters and editions are part of the value itself. A buyer can already own the product category and still want another item. The uncertainty that produces a reveal can also produce a duplicate, an exchange or a decision to stop.
Kasing Lung created THE MONSTERS and Labubu. Pop Mart built products and distribution around that work, alongside other artist relationships and licensed characters. The business could expand across borders while retaining the appeal of a particular artist’s creations. Pop Mart Japan’s artist account.
The financial scale changed quickly. Group revenue rose from RMB4.617 billion in 2022 to RMB37.120 billion in 2025. In the latter year, overseas revenue was RMB16.268 billion, or 43.8% of the total. THE MONSTERS accounted for 38.1% of group revenue; it is a wider character family than Labubu alone. Plush products supplied just over half of revenue. A business often described through plastic blind-box figures had a very large plush-product business by the end of the period. 2022 results, 2025 results.
The concentration cuts both ways. A character that works can be extended into forms, stores and markets that make the business much larger. Its prominence also exposes the company to changes in the desire to own it. The campaign archive makes that desire concrete; the accounts establish how much money depended on the resulting assortment. Neither promises that the next year will resemble the last.
With Pop Mart, the Chinese company’s product was the one being imitated. A cheaper figure could fail precisely because it was not the right Labubu or Skullpanda. Pop Mart was selling the identity of the object, and buyers were checking whether other sellers could supply the real thing.
A Chinese owner is a different claim from a Chinese-origin brand
Sportswear makes the definition of the subject unavoidable. ANTA Sports increased group revenue from RMB53.651 billion in 2022 to RMB80.219 billion in 2025. But the group includes businesses built around foreign-origin names. Its 2025 FILA segment produced RMB28.47 billion, compared with RMB34.75 billion for the ANTA segment. Group growth was 13.3%; growth in the namesake segment was 3.7%. Treating the whole group as the rise of the ANTA label would conceal much of what the company actually operates. ANTA financial history, 2025 results.
That distinction changes the historical account. Chinese companies can gain power by developing a new name, operating an acquired brand, manufacturing for an incumbent or eventually owning it. The iRobot transaction is another example. These routes can share capital and industrial capabilities while producing very different experiences for the customer.
Foreign-origin brands also continued to grow. Adidas reported 5% revenue growth in Greater China in calendar 2025; growth was 9% excluding currency movements. Lululemon reported 29% revenue growth in China Mainland in its fiscal 2025, which ended in February 2026. These figures use different periods and regional definitions, so they are not a ranking. They are direct obstacles to a claim that Chinese consumers had collectively abandoned foreign premium brands. Adidas Greater China, Lululemon results.
ANTA shows that the rise of Chinese companies need not mean the disappearance of foreign brands. The same group could compete through its own name and through FILA. For a rival, the important question was who controlled the brand, the distribution and the investment behind it—not simply which country the logo brought to mind.
By autumn 2026, scale had become an obligation
On September 28, 2026, Wavytalk announced that it was extending an earlier online relationship with Ulta Beauty into selected stores across the United States. The announcement included retailer-specific colors and a product exclusivity. The company was adding a specialist retailer to the purchase routes described in its tutorials. Wavytalk announcement.
Less than a month later, Pop Mart disclosed a sharp reversal. Its preliminary update put third-quarter 2026 revenue 45–50% below the same quarter of 2025. The decline in America was 70–75%. These were unaudited management-account ranges, and the disclosure did not establish a single cause. They are nevertheless part of the same history as the extraordinary 2025 growth. October 27 trading update.
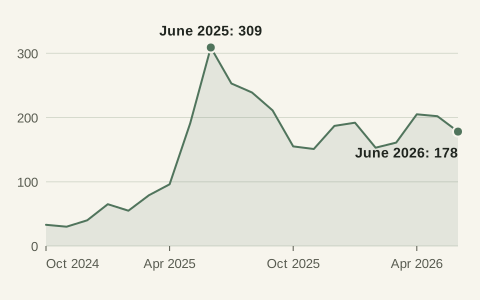
The archive’s TikTok records end on July 17, 2026, so they do not cover that quarter. They do show the period before it. Captured US-market posts associated with Pop Mart peaked at 309 in June 2025 and stood at 178 in June 2026, while the archive’s total US capture grew thirteenfold. A count of captured posts is not a count of sales, and it does not explain the decline.
UNRANDOM / TIKTOK · POP MART · US CREATOR MARKET · OCTOBER 2024–JUNE 2026
Pop Mart’s US posts peaked in June 2025
Figures and method
| Month | Captured posts | Accounts |
|---|---|---|
| October 2024 | 33 | 23 |
| November 2024 | 30 | 22 |
| December 2024 | 40 | 27 |
| January 2025 | 65 | 38 |
| February 2025 | 55 | 30 |
| March 2025 | 79 | 49 |
| April 2025 | 96 | 53 |
| May 2025 | 191 | 100 |
| June 2025 | 309 | 149 |
| July 2025 | 253 | 145 |
| August 2025 | 239 | 120 |
| September 2025 | 211 | 125 |
| October 2025 | 155 | 94 |
| November 2025 | 151 | 88 |
| December 2025 | 187 | 100 |
| January 2026 | 192 | 99 |
| February 2026 | 153 | 82 |
| March 2026 | 161 | 106 |
| April 2026 | 205 | 119 |
| May 2026 | 202 | 123 |
| June 2026 | 178 | 107 |
Source: unrandom campaign archive; Brandnotomy calculations. Download data (CSV) · How we counted
The source material supplies a small reminder of the uncertainty inside a collecting business. In July 2026, one creator attributed a purchase to watching other people open boxes and the fear of missing out, then described it as a one-time purchase. That is one account, not an explanation of the company’s decline. It shows why a first purchase and a lasting collecting habit cannot be assumed to be the same thing. Archived collector account.
Proya’s results reveal another pressure. Group revenue in 2025 was still roughly two-thirds higher than in 2022, but fell 1.68% from 2024; the namesake brand fell 10.39%. Selling expenses reached RMB5.259 billion, equivalent to 49.63% of group revenue. Most of that expense category was image, publicity and promotion spending, though the company did not identify it as a creator-only budget. Sustaining attention was a substantial ongoing expense, and a larger group did not guarantee growth in its leading label. Proya annual filing.
These outcomes return us to the Mother’s Day campaigns. A Proya gift and a L’Oréal gift could occupy similar family stories. What mattered afterward was whether the customer liked the product, bought again and could be reached at a sustainable cost. A bottle washer still had to earn its counter space. A printer still had to work after the first project. A car needed support years after its launch video. A character needed another reason to be wanted.
The advance of Chinese brands since 2022 is visible in those obligations. These businesses had grown large enough to face obligations beyond the first purchase: product support, dependable availability and reasons to return. In cars, the aggregate sales evidence shows a majority of global electric-car sales. In other categories, the evidence supports particular companies becoming much larger, more international or more consequential to the choices around them. Those are different outcomes, and each is substantial enough without borrowing the others’ statistics.
These Chinese brands had become alternatives competitors had to take seriously—and, in some cases, the names buyers sought out specifically. Proya was claiming the standing of an established beauty brand. BYD was building the support behind a long-term purchase. Pop Mart had characters people wanted by name. Getting there was the achievement. Keeping that position was now the business.
Sources and method
This is a historical account of 2022–2026, written on November 10, 2026. Complete-year comparisons generally end in 2025; 2026 observations are dated partial-year developments. The cases were selected to explain mechanisms across industries, not to estimate the market share of Chinese brands as a whole.
The research began with a metadata census of 45,276 China-platform campaign records. The searchable narrative inventory contained 29,486 generated Douyin/Xiaohongshu write-ups and 3,052 TikTok brand-market dossiers: 32,538 units. An initial stratified editorial screen examined 120 units; full-inventory text searches checked coverage and surfaced additional leads. Supplementary work brought the total to 122 distinct screened units. We did not manually read all 32,538 narratives.
The initial source audit covered 33 selected packets containing 603 distinct platform-post records, using chronological spread and lower- and higher-engagement examples. For the charts, six selected campaign cohorts were expanded to their full stored memberships: 136 Proya activation posts, 65 posts in the Proya/L’Oréal pair, and 215 across the Dreame, Roborock and Tineco collections. These overlap the initial audit; the combined retrieval contains 904 distinct post records. Caption counts use the complete stored membership of the named case, not all campaigns run by the brand. Source-text inspection and rule-based counting are distinct from full audiovisual review.
The format analysis uses the full 45,276-record campaign metrics census to identify recurring Xiaohongshu brand identifiers. Within each year, we average the video share of their campaigns, then weight each identifier equally. Regional or retail identities can remain separate. The source measure averages known post formats. The 513-identifier panel contains 7,715 campaigns in 2022–2024; matched seasonal windows and minimum-activity thresholds are reported in the downloadable sensitivity table. The 2025 direction is not robust to those thresholds. Both Chinese and foreign brands are included.
The TikTok analysis starts with 2,949 existing-dossier brand–creator-market groups with posts dated in 2025. Of these, 921 meet the minimum of 100 captured non-brand-account posts and 20 identified accounts, contributing 382,458 brand-post memberships. A post can belong to more than one brand group, so this is not a count of globally unique videos. An account qualifies for the thirty-day measure when its first and last captured brand-associated posts in 2025 are at least 30 days apart; all its captured posts in that group and year then enter the contribution count. Account IDs and join uniqueness were checked. The median account share (20.2%) and median post share (47.4%) are separate statistics across groups, not a claim that one pooled fifth of creators produced half of all posts.
The shop-link analysis uses the archive’s TikTok brand–market summaries, which leave out posts marked as coming from the brand’s own account. A group is one brand in one creator market. The 1,835 groups with at least 100 captured posts cover 893 brands and 1,434,985 brand-post memberships; a post can belong to more than one brand group. The link flag is TikTok’s own marker for a post that carries a shopping anchor. It does not register discount codes, links in a profile, or sales through a brand’s own app or site. The three origin classes are the archive’s existing machine classification of each brand; brands it could not classify are left out. We did not audit them brand by brand, they can contain errors, and they are not a legal test of ownership. Medians are taken across groups, so a brand present in many markets counts once per market; counting each brand once gives the same order. Posts are dated from November 2019 to July 2026, and 93.2% of the 1.53 million posts in these three classes are dated 2025 or later. Markets are creator-market attributions, not buyer locations. Named-brand figures pool all of a brand’s creator markets, including those with fewer than 100 posts.
The Pop Mart series counts captured posts associated with Pop Mart in the US creator market by month of posting, leaving out the brand’s own accounts. Capture is neither complete nor constant over time. July 2026 is a partial month and is not shown.
Generated campaign readouts served as discovery and interpretation aids. The supplementary classification table counts existing messaging tags across 26,793 China-platform readouts beginning in 2022–2025. Labels overlap, are capped and may contain errors; an absent tag does not prove a theme was absent. Chinese and foreign brands are both included, and Douyin and Xiaohongshu are kept separate. Guochao denotes Chinese cultural/style positioning in this taxonomy, not a measure of political nationalism or consumer preference.
Explore the broader campaign classifications
Selected Xiaohongshu categories, 2022–2025. Percentages are shares of readouts tagged with each theme, not shares of consumers. The full analysis counts 16,796 XHS and 9,997 Douyin readouts.
| Category | Readouts | Problem / solution | Guochao |
|---|---|---|---|
| Skincare | 2,111 | 74.6% | 8.2% |
| Parenting / baby | 926 | 79.8% | 4.8% |
| Home / living | 1,520 | 64.8% | 3.6% |
| Food | 3,559 | 18.9% | 9.6% |
| Fashion | 1,858 | 13.5% | 13.3% |
| Automotive | 474 | 19.4% | 5.5% |
| Beauty | 1,032 | 25.0% | 6.1% |
| Technology | 802 | 36.0% | 4.5% |
Brand-equal weighting preserves the broad problem/solution contrast: skincare 83.0%, parenting/baby 79.8%, home/living 62.0%, food 23.8%. Removing the largest brand in each category also preserves it. These checks address weighting; they do not independently validate the machine-coded labels.
All 16 themes and platform breakdowns (CSV) · Weighting and coding-cap checks (CSV)
Consequential case claims were checked against available source text and separate business evidence. The retained comments are selected snapshots without commenter-level deduplication or reliable timestamps; none came with the TikTok source packets. They cannot support representative sentiment estimates. No full video was watched or audio independently transcribed for this article. Published archival photos and covers were visually inspected. Most social links are original-post locators backed by stored captions or machine transcripts; live access is uneven. Three Pop Mart posts were additionally checked against currently accessible metadata and subtitle tracks. A post’s brand tag does not establish who paid for it, and a creator’s market label does not establish the location of the activity described.
Company reports establish reported outcomes, not the contribution of the sampled posts to those outcomes. Category definitions, reporting periods, currency bases and brand ownership are kept separate. Archived source inspection and editorial selection make this an evidence-based set of cases, not a controlled causal study.
Research partnership: Brandnotomy partners with unrandom and uses its campaign data to produce these findings through carefully harnessed agentic research frameworks. Brands and creators analyzed here are not thereby clients, partners or endorsers of unrandom or Brandnotomy. See our editorial policy.
Campaign image ownership: Campaign images are reproduced from posts on Douyin and Xiaohongshu, accessed through unrandom’s archive. Copyright and other rights remain with their respective creators and rights holders, including the platforms where applicable. Brandnotomy does not claim ownership. Original posts and accounts are credited beside each image. These archival images are distinct from the AI-generated editorial cover.
Written by Brandnotomy Editorial.
Last reviewed Nov 10, 2026.